Create a Project Single Tool Report
Objective
To add a custom report using Procore's 360 Reporting tool.
Background
The 360 Reporting tool gives users the ability to create, generate, and export customised reports. When designing a report, its author can include data captured by specific Procore tools, specify the desired column layout, and also define how to group and filter report data. After generating a report, it can also be exported from Procore into Microsoft Excel.
Things to Consider
- Required User Permissions:
- To create a single tool project report, 'Standard' permissions or higher on the project 360 Reporting tool, plus permissions for the data source tool:
- Directory: 'Admin' level permissions.
- Financial Management Tools: 'Standard' level permission or higher.
- All Other Tools (Core, Project Management, Quality & Safety): 'Read Only' level permissions or higher.
- To create a 360 project report: 'Standard' level permissions or higher on the Project 360 Reporting tool, with additional permissions depending on the field group.
- To create a single tool project report, 'Standard' permissions or higher on the project 360 Reporting tool, plus permissions for the data source tool:
- Additional Information:
- Custom reports are only visible and available to the individual who created them.
- Reports can include data from these Procore tools and sources:
- Action Plans
- Tendering
- Budget
- Change Management
- Change Event Line Item Details
- Potential Variations
- Variations
- Commitments
- Co-ordination Issues
- Site Diary
- Daily Construction Report Register
- Call Register
- Notes Register
- Delay Register
- Skip Register
- Quantity Register
- Timecard Entry
- Working Hours Register
- Visitor Register
- Equipment Register
- Accident Register
- Productivity Register
- Weather Register
- Inspection Register
- Delivery Register
- Site Diary Completion
- Waste Register
- Workplace Hazards and Incidents Register
- Directory
- Drawings
- Financial Line Items
- Configurable Budget Snapshots
- Financial Line Item Details
- Financial Line Item Summary
- Forms
- Incidents
- Incident Injury Records
- Incident Near Miss Records
- Incident Records (All)
- Incidents
- Inspections
- Inspection Item Details
- Inspection Summary
- Labour Productivity
- Meetings
- Meeting Attendance
- Meeting Items
- Meetings
- Models
- Observations
- Owner Progress Claims
- Owner Progress Claims
- Photos
- Portfolio
- Head Contract
- Project Roles
- Defect List
- RFIs
- Program Tasks
- Program Tasks
- Lookaheads
- Requested Changes
- Specifications
- Subcontractor Progress Claims
- Subcontractor Progress Claims
- Submittals
- Tasks
- Daywork Sheets
- Materials
- Tickets
- Timecards
- Equipment
- Timesheets
- Timecard Entries
- Production Quantities
Create a New Custom Report
- Navigate to the Project 360 Reporting tool.
- Click Create Report in the top right corner.
- Click Single Tool Report.
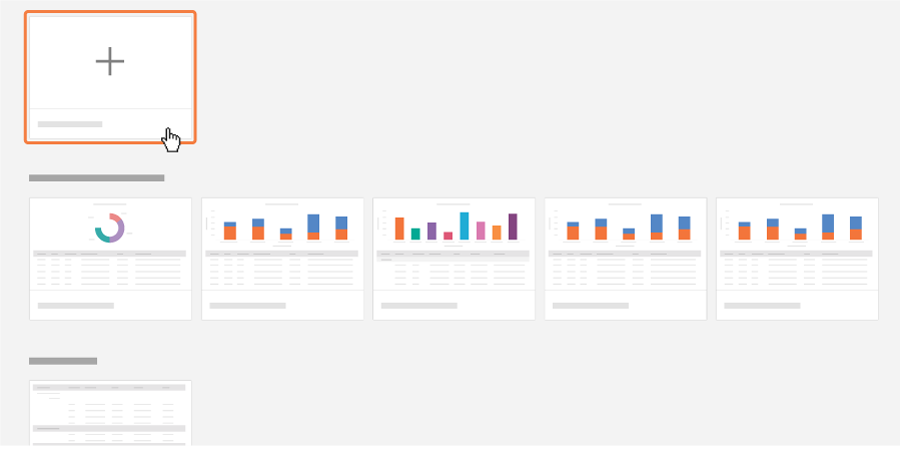
- You will then have the option to Create a New Report or choose an existing template. To create a brand new report, click the Create New Report tile.
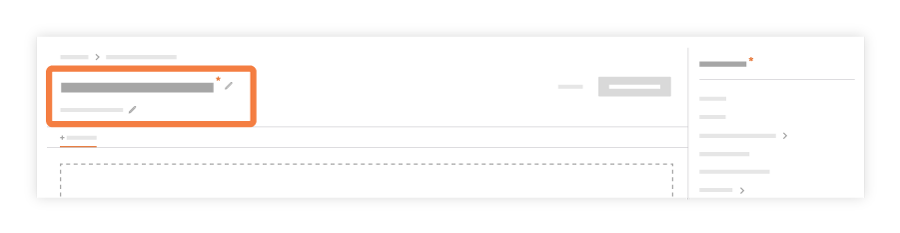
- Enter in the report name by clicking the pencil icon next to Enter Report Name.
- Enter in a description of the report by clicking the pencil icon next to Enter Description.
- In the right pane is a list of tools you can report on. Select a tool you wish to report on.
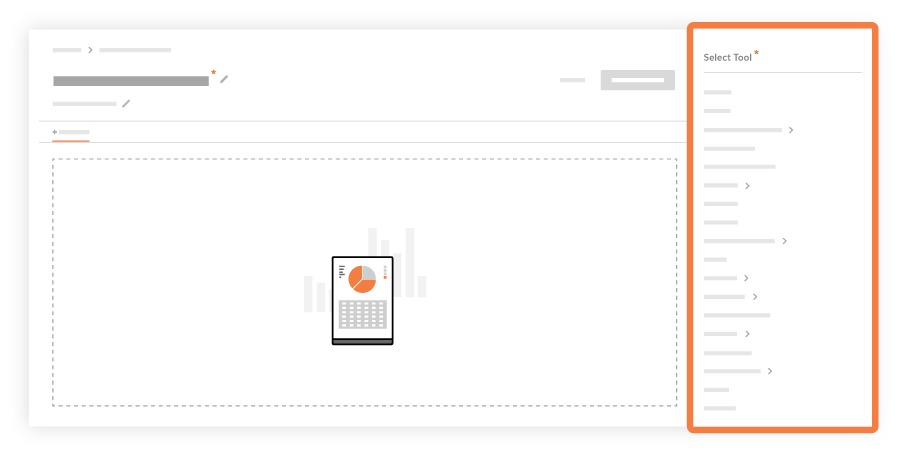
- Once you have selected a tool, the right pane will populate with a list of columns you want to add to your report. Drag and drop columns into your report, or add all of the columns by clicking Add All.
- Once you've added the desired columns, you have these options:
- Group report data
In the Group by list, select one of the items in the drop-down menu to group report data by the specified column (e.g., you may want to group data by the responsible contractor). - Filter your report data
Click the Add Filter drop-down menu to select what you would like to filter by. Once you've specified a filter, you can add another filter. You can also filter data by date range by selecting a start and end date. - Change the column order
Use a drag-and-drop operation to place the column into the desired position. - Aggregate data
Click the fx in the column and select one of the following (for numeric values): count, sum, min, max, or average. Once the report is created, you will see the count, sum, min, max, or average of the values at the bottom of the column. For field types that are not a numeric value, you have the option to aggregate by count.
- Group report data
- Once you've added the desired columns, you have these options:
-
To add a new tool to your report, click Add Tab at the top of the report and repeat step 6-7 above.
-
When finished configuring your report layout, click Create Report.