How do I view resource allocation percentage?
Background
The Resource Planning tool provides real-time insight into your resource availability, resource requests and resource assignments. You can create resource requests and assignments and view them based the number of hours a person is assigned, or by the percent of time a person is allocated to a project.
Regardless of the 'Allocation Type' entered (hours or percent), you can configure the Assignments Gantt to show how people are allocated to projects based on a percentage. This can help you:
- Understand how people's time is allocated when working on multiple projects
- Ensure your project is operating at capacity
- Identify labour overages
Tip
You can use this feature for forecasting by updating the visibility of the assignment status. See Configure Request and Assignment Statuses for Resource Planning.Answer
Allocation percent is calculated based on the working hours ('Paid Hours Per Shift') set in your Costing settings. Allocations only account for 'Paid Hours Per Shift', regardless of the assignment's programd hours or the project's default start and end times. To show labour overages, you must enable overtime. See Configure Costing in Resource Planning.
Example
A company has eight paid hours per shift configured in their Costing settings. Overtime is not enabled.
An assignee is assigned a 10 hour shift. Allocation displays 100% based on the paid hours per shift.
A company has 8 paid hours per shift configured in their Costing settings. Overtime is enabled.
An assignee is assigned a 10 hour shift. Allocation reflects 125%.
On the Assignments Gantt, you can see percent allocation by:
View Allocation Percentage by People
Viewing allocation percentage by people helps you identify labour overages and to ensure your project is operating at its full capacity.
When viewing allocation by people, you have two options:
- You can see percentage allocation in the 'Totals' column to display the person's total allocation per day.
- You can set 'Assignment Colour Bars' to reflect a person's allocation percentage for their assignment. Allocation percentage is reflected by different shades of green and red. As the allocation percentage increases, the shading changes from light to dark. When someone's allocation reaches over 100% for a single project, and overtime is enabled, the highlighting turns red.
Example
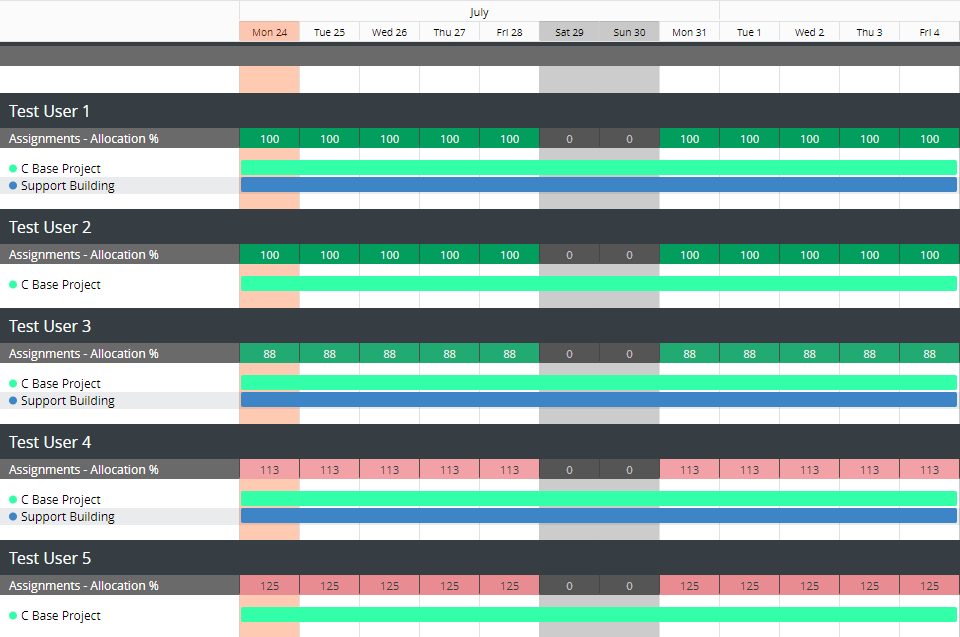
In this example, people are assigned and working across two projects, C Base Project and Support Building. The Costing Settings are set to 8 working hours.
- Test User 1 is programd for 6.5 hours per day at C Base Project and 1.5 hours per day at Support Building. The total allocation is 100%.
- Test User 2 is programd for 8 hours per day at C Base Project. The total allocation is 100%.
- Test User 3 is programd for 5 hours per day at C Base Project and 2 hours per day at Support Building. The total allocation is 88%.
- Test User 4 is programd for one hour per day at C Base Project and 8 hours per day at Support Building. The total allocation is 113%.
- Test User 5 is programd for 8 hours per day, plus two hours of overtime per day. The total allocation is 125%.
To view allocation percentage by people:
- Navigate to the Company level Resource Planning tool.
- Click Assignments and select Gantt.
- Select the Group.

- Select People.

- Select your date range.
- Click Configure.

- Select 'Total Cell Units' to display column totals by Allocation.
- Select to display Gantt 'Bars Solid/Split' by Solid Bars for the entire resource request or assignment, or Working Day Splits.
- Select to show 'Assignment Bar Colours' by Allocation %.
- Click Apply.
View Allocation Percentage by Project
Viewing allocation percentage by project enables you to see how people are allocating their time to your specific project. It also allows you to see when people assigned to your project are working overtime.
When viewing allocation percentage by project, 'Assignment Colour Bars' reflect different shades of green and red, representing their allocation. As the percentage of allocation increases, the intensity of the green increases. When someone's allocation reaches over 100% for a single project and overtime is enabled, the colour bar turns red.
Example
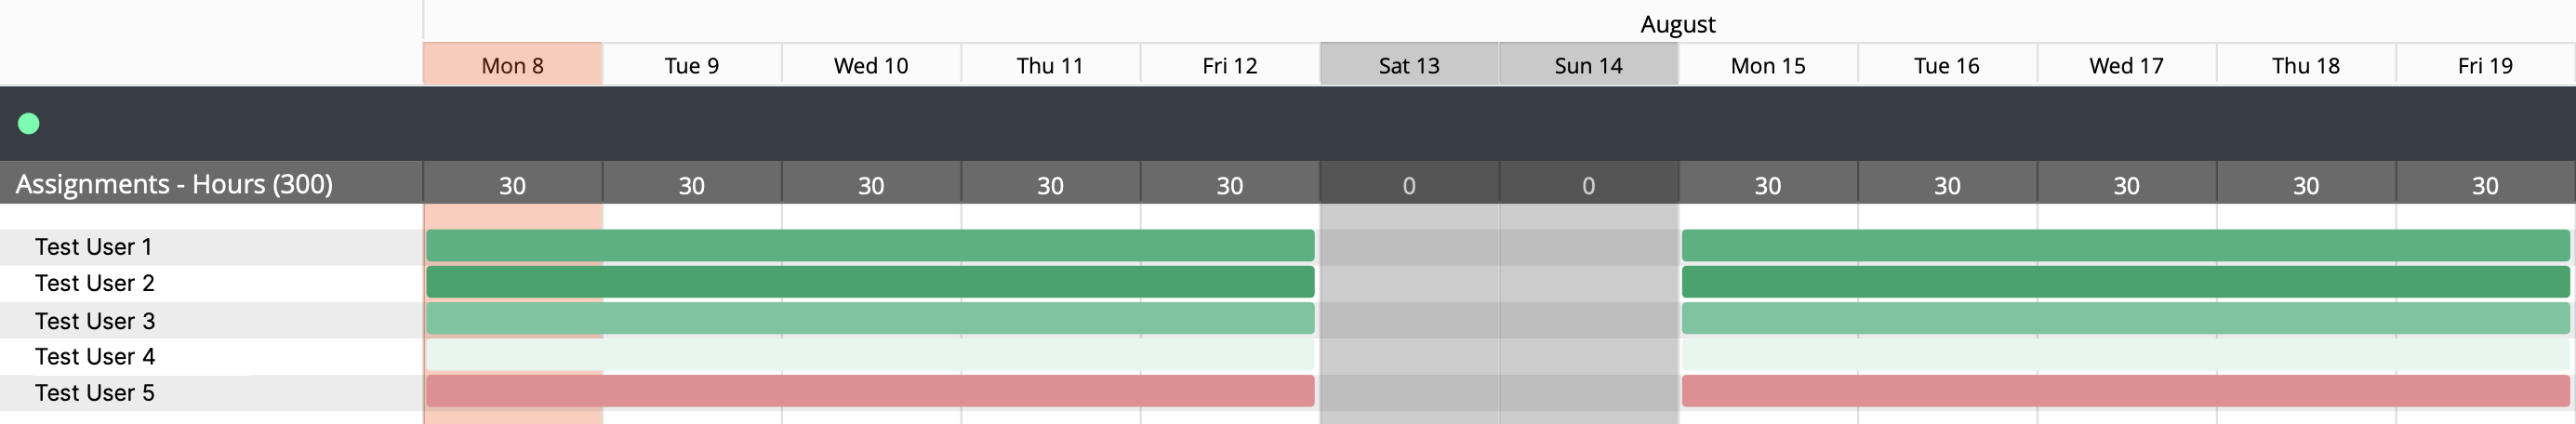
In this example, the Costing Settings are set to 8 working hours with overtime enabled.
- Test User 1 is programd for 6.5 hours per day.
- Test User 2 is programd for 8 hours per day.
- Test User 3 is programd for 5 hours per day.
- Test User 4 is programd for one hour per day.
- Test User 5 is programd for 8 hours per day, plus two hours of overtime per day.
To view allocation percentage by project:
- Navigate to the Company level Resource Planning tool.
- Click Assignments and select Gantt.
- Select the Group.
- Select Projects.

- Select your date range.
- Click Configure.
- Select to display Gantt 'Bars Solid/Split' by Solid Bars for the entire resource request or resource assignment, or Working Day Splits.
- Select to show 'Assignment Bar Colours' by Allocation %.
- Click Apply.