How do Procore's 'Advanced Forecasting' curves distribute 'Projected Cost to Complete Amounts' amounts?
Background
Procore's Advanced Forecasting feature in the 'Forecasting' tab project's Budget tool uses a variety of pre-defined spread curves to automatically distribute the 'Projected Cost to Complete' column value across a date range that you define. This feature is available to all of Procore's Project Financials users to help Budget tool users to spread your project costs over a programd duration to see your project's monthly cost impact and cash needs.
Answer
The following examples explain how Procore's pre-defined Advanced Forecasting curves distribute the 'Projected Cost to Complete' column value in the 'Forecasting' tab of the project's Budget tool. Keep in mind that using the 'Projected Cost to Complete' column is Procore's default behaviour and that you can change which column Procore uses as the total amount to distribute. For instructions, see Apply Advanced Forecasting Curves.
Linear vs. Non-Linear Distribution Options
In addition to allowing you to define your distribution manually, Procore's Advanced Forecasting curves provide you with a choice between a linear and several non-linear distribution options:
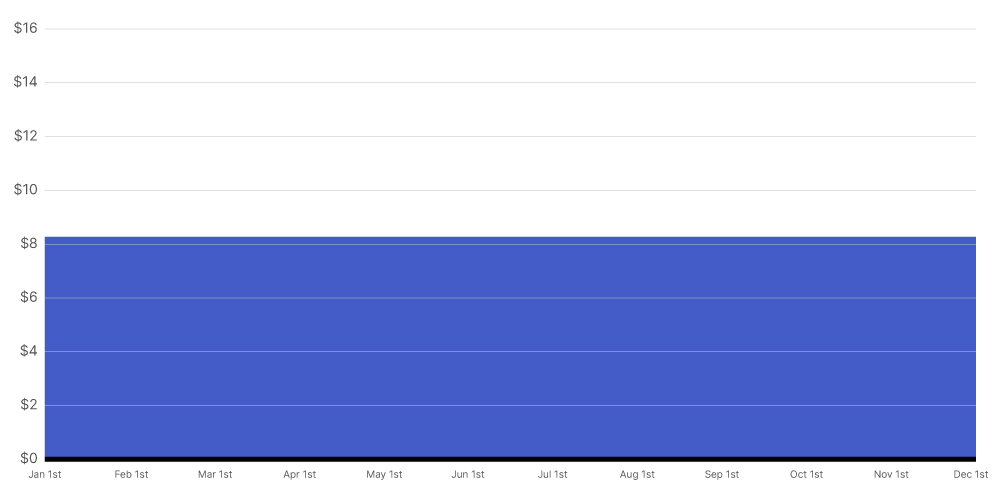
Linear
A linear curve shows even spending of the 'Projected Cost to Complete' amount over your selected time period. Procore uses the following logic to distribute the amount evenly over each month in that time period.
total_amount = total amount to distribute
total_number_of_periods = total number of months over which you want to distribute the total_amount
period = the n'th month for which you want to allocate an even portion of the total_amount
amount(period) = total_amount / total_number_of_periods
Example
This illustration shows you a Linear curve for a 'Projected Cost to Complete' amount of $100.00 when it is distributed over a 12 month time period.
Non-Linear
All of the non-linear curves distribute 'Projected Cost to Complete' amount using a Cumulative Distribution Function (CDF) of a standard normal distribution. This allows Procore to allocate the total amount in the 'Projected Cost to Complete' column by distributing a portion of that total amount into each month's column for the time period you specify. To determine the amount to allocate to each month in the specified time period, Procore first calculates the difference in the percentage distributed between a specific month and the month before it. Next, it multiples the difference by the total amount.
This is expressed as:
nd = normal distribution where mean = μ and standard_deviation = σ
cdf(x) = cumulative distribution function of nd (The probability/percentage of nd that is less than or equal to x)
total_amount = the total amount of the 'Projected Cost to Complete' column
period = the n'th month that the amount is for
amount(period) = (cdf(period) - cdf(period - 1)) / (1 - 2 * cdf(0)) * total_amount
The shape of the distribution curve depends on the curve you choose to apply. Each curve uses a different number of months and its evaluation is based on a different mean and standard deviation. The differences between each curve are detailed below. Procore provides you with three (3) shapes:
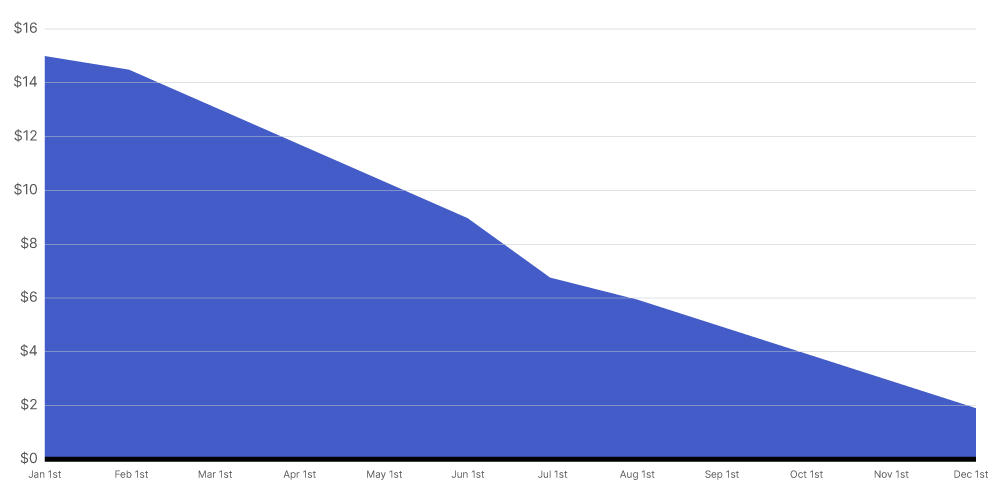
Front-Loaded Curve
A front-loaded curve shows more spending at the beginning of the selected time period and less spending at the end of that time period. The front-loaded curve uses the same distribution, mean and standard deviation as the back-loaded curve and then reverses its result to distribute greater amounts to the front-end of the time period.
n = number of months
σ = (ln(0.6 * n))^2.5
μ = n / 2
Example
This illustration shows you a Front-Loaded curve for a 'Projected Cost to Complete' amount of $100.00 when distributed over a 12 month time period.
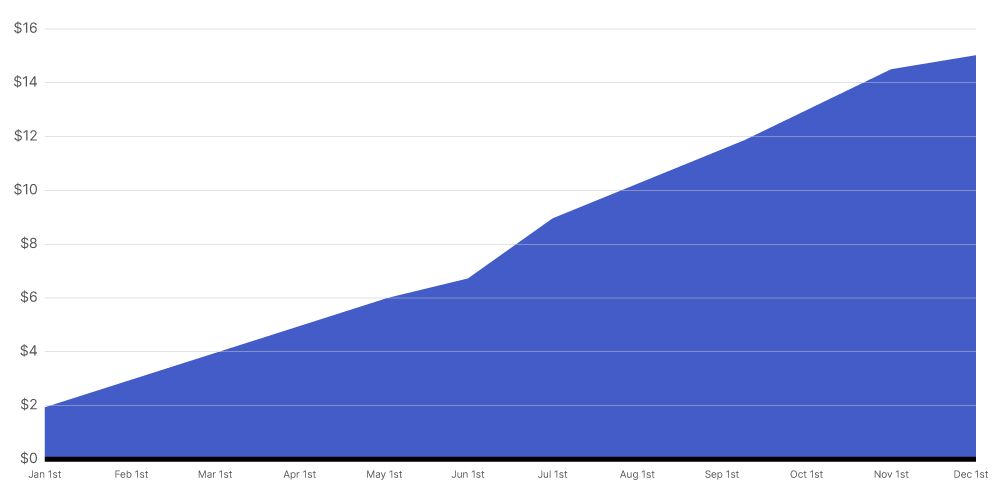
Back-Loaded Curve
A back-loaded curve shows less spending at beginning of the time period and more at the end of the time period. The back-loaded curve uses the following distribution, mean and standard deviation:
n = number of months
σ = (ln(n))^2.35
μ = n
Example
This illustration shows you a Back-Loaded curve for a 'Projected Cost to Complete' amount of $100.00 when distributed over a 12 month time period.
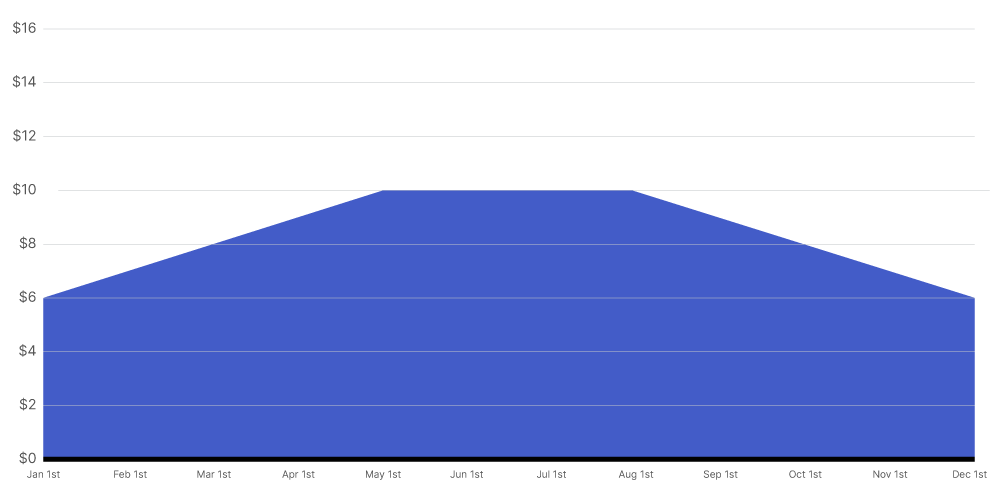
Bell Curve
A bell curve shows less spending at the beginning and end of the and more spending at the middle of the time period. The bell curve uses the following distribution, mean and standard deviation:
n = number of months
σ = (ln(0.6 * n))^2.5
μ = n / 2
Example
This illustration shows you a Bell curve for a 'Projected Cost to Complete' amout of $100.00 when distributed over a 12 month time period.