Analyse Variance Between Budget Snapshots
Background
If you maintain a project's budget in Procore, you can record how your budget changes over time with the snapshot feature. You might want to create a snapshot at the end of each month, after you update your budget.
Every project team needs to know what is changing month-over-month, so that risk can be identified and mitigated. With the Analyse Variance feature in the Budget, you can compare snapshots directly to each other, or to your Current Budget, to identify variance down to the most granular, line-item level. This allows project teams to quickly and easily identify where things are shifting on the project, directly in the Budget, without the need for side spreadsheets.
Things to Consider
-
Required User Permissions:
-
To create a snapshot, 'Standard' level permissions or higher on the Project level Budget tool.
-
To view all snapshots created in a project, 'Read Only' level permissions or higher on the Project level Budget tool.
-
-
Additional Information:
-
The Budget view Analyse Variance tool does not allow comparison of quantity-based columns between snapshots or current data. Only columns that allow for aggregation (summary of values vertically) are included in this tool.
-
Prerequisites
Steps
Analyse Line Item Variance on the Budget Tab
In Beta
An enhanced budget table is available for analysing line item variance between budget snapshots. See Analyse Line Item Variance Between Budget Snapshots (Beta).This action analyses variance by comparing a snapshot with the active budget.
-
Navigate to the project's Budget tool.
-
Click the Budget tab and select a standard or custom budget view from the View menu.
-
Click Analyse Variance.
This opens the Select Comparison Columns to Analyse Variance window. -
From the Comparison Snapshot menu, select the snapshot to compare it with your budget data.
-
Under Columns to Display, choose one (1) option:
-
Comparison Column and Variance Column. Shows both values.
-
Comparison Column Only. Shows the value from the comparison snapshot.
-
Variance Column Only. Shows the variance between the comparison snapshot and active budget.
-
-
Under Comparison Columns, mark one or more checkboxes to select the columns to analyse for variance.

-
Click Save.
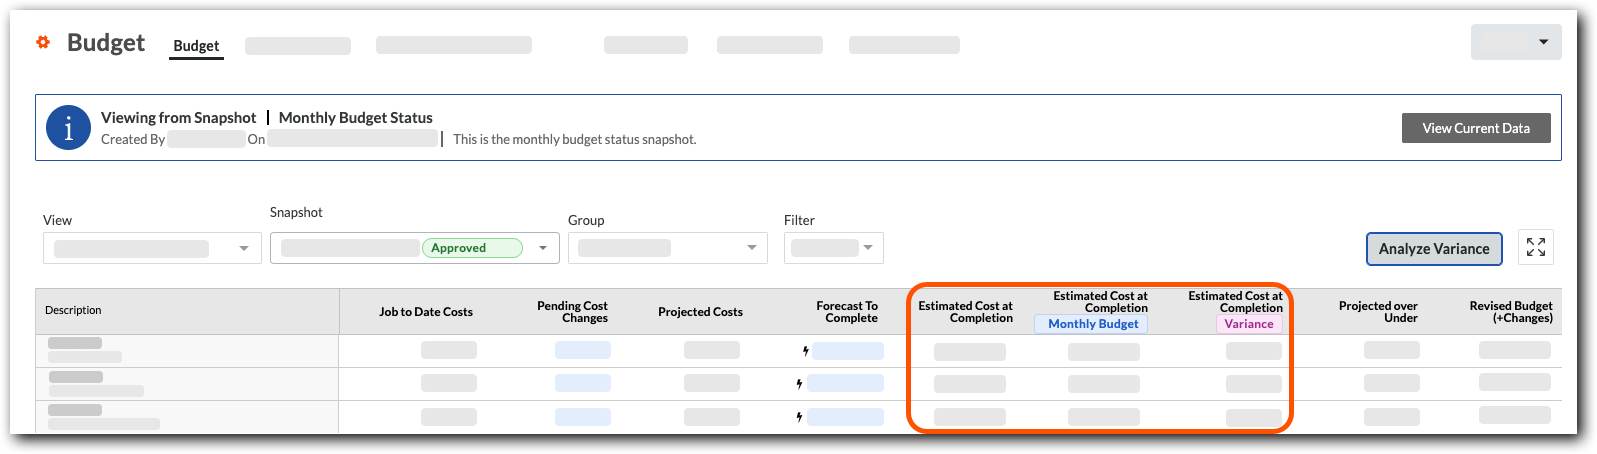
Procore analyses the current budget and snapshot for variance.Example
This example shows the Comparison Column and Variance Column option using Estimated Cost at Completion as the comparison column. The blue column label shows the snapshot data. The column labelled Variance shows the difference between the snapshot and your budget.
Analyse Aggregate Variance Between Snapshots on the Project Status Snapshots Tab
This action analyses the aggregate variance between two snapshots.
-
Navigate to the project's Budget tool.
-
Click the Project Status Snapshots tab and select a standard or custom budget view from the View menu.
-
Click the snapshot Name to open it.
-
On a column where it's available, click the Variance icon.
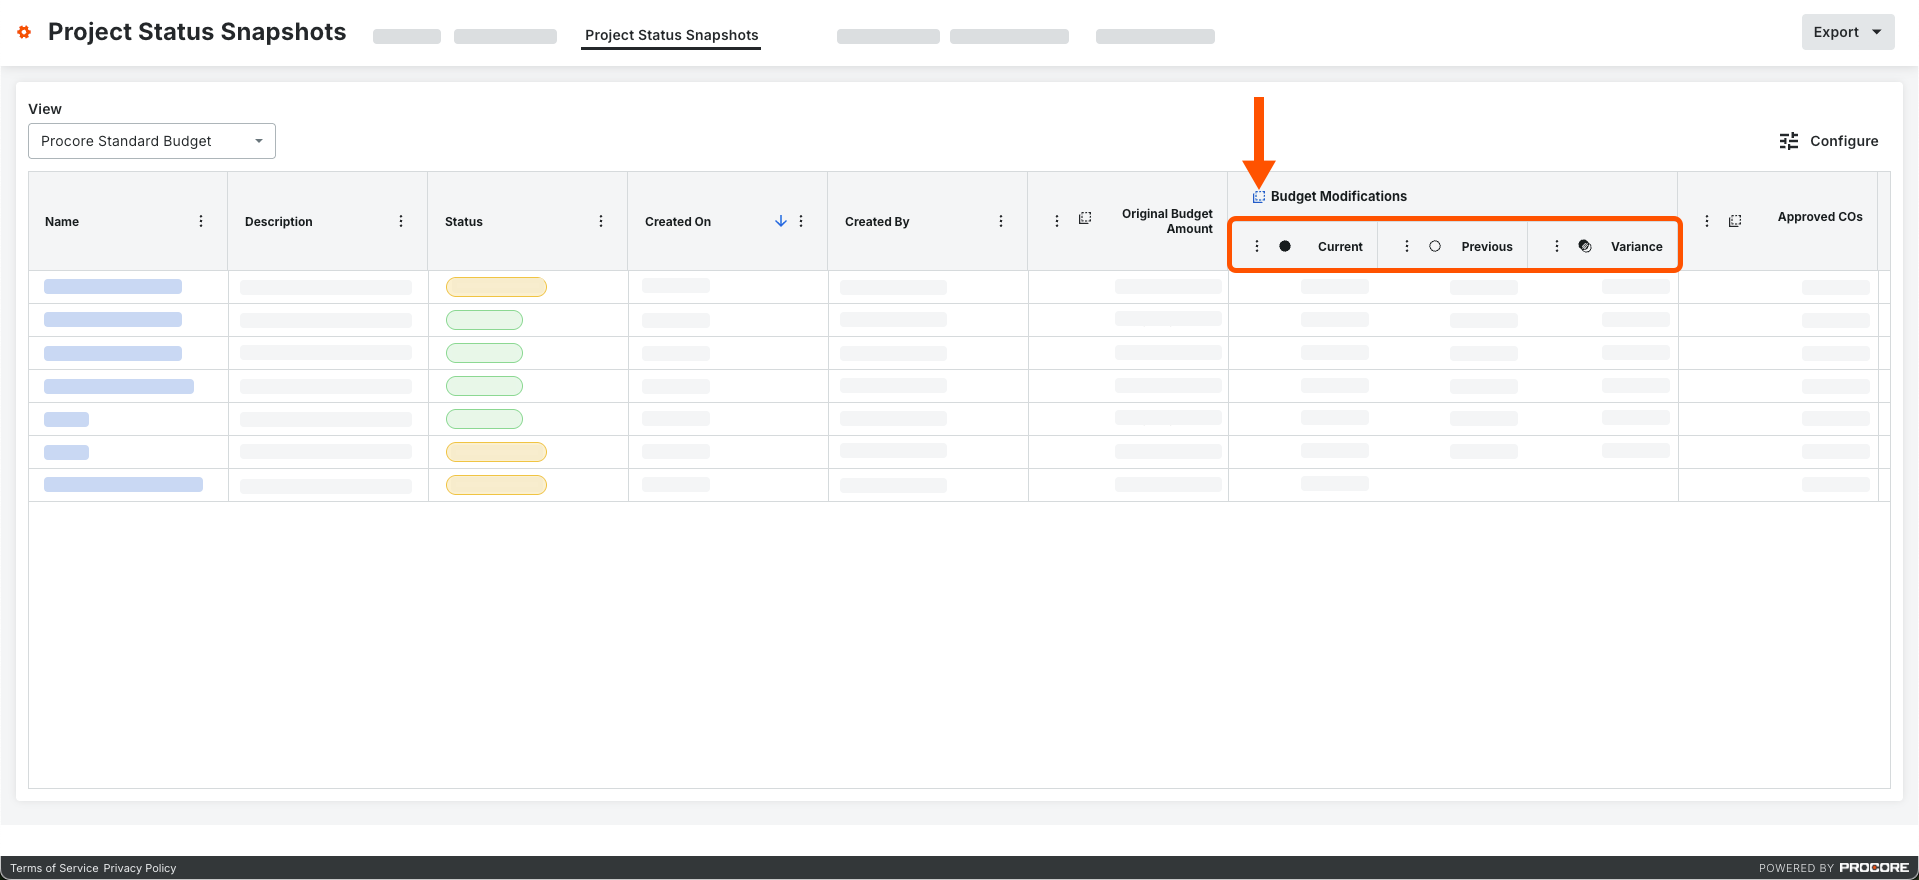
This expands the column to show the Current, Previous, and the Variance between the two snapshots.Example
This example shows the Current, Previous, and Variance columns that appear when you click the Variance icon on a column.